Interactive Experience · UX/UI

The innovation gallery


A modular, interactive gallery that digitises a corporate innovation program into a browsable, expressive experience.

View live site ↗

Role

UX/UI & Visual Design

Client

Novartis × SIT

Year

2024

Timeline

6 weeks

Tools

Figma, Elementor

Overview

This interactive gallery was created to digitise the outcomes of the Novartis Innovation Training program. What began as a plan for a physical exhibition became a sleek digital experience that showcases the creative talent and groundbreaking ideas of the organisation’s iCoaches — and gave the program org-wide visibility, bringing their work to colleagues far beyond the training room.

The Challenge

Branding synergy & content management

My primary objective was to integrate the established scientific authority of Novartis with the bold, inventive methodology of SIT. Visually, I had to solve significant information overload — moving away from a fragmented, long-scroll display that obscured the program’s core value, towards a structured system that balances professional rigour with creative humour.

The Solution

A structured, interactive experience

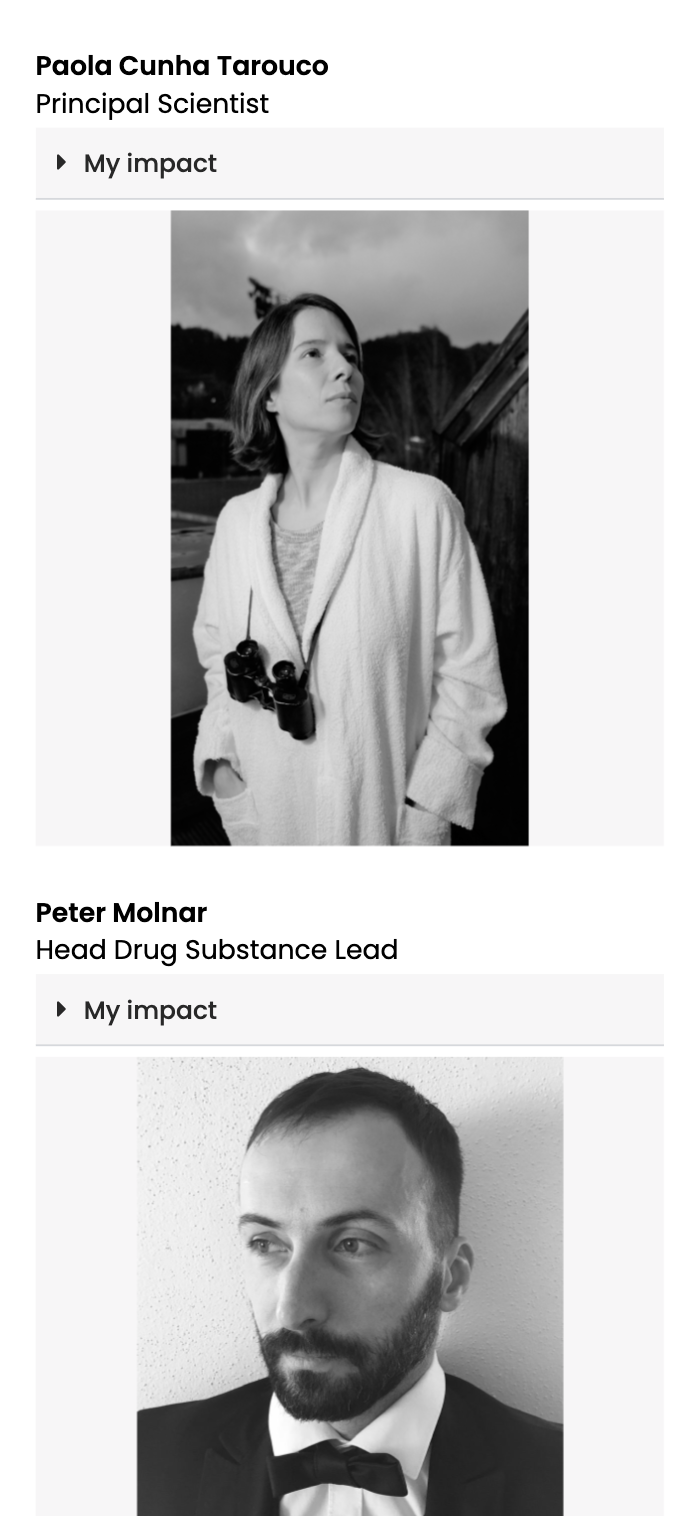
Transforming complex scientific data into a streamlined digital gallery through a modular system of hierarchy and discovery.

01

Interactive grid system

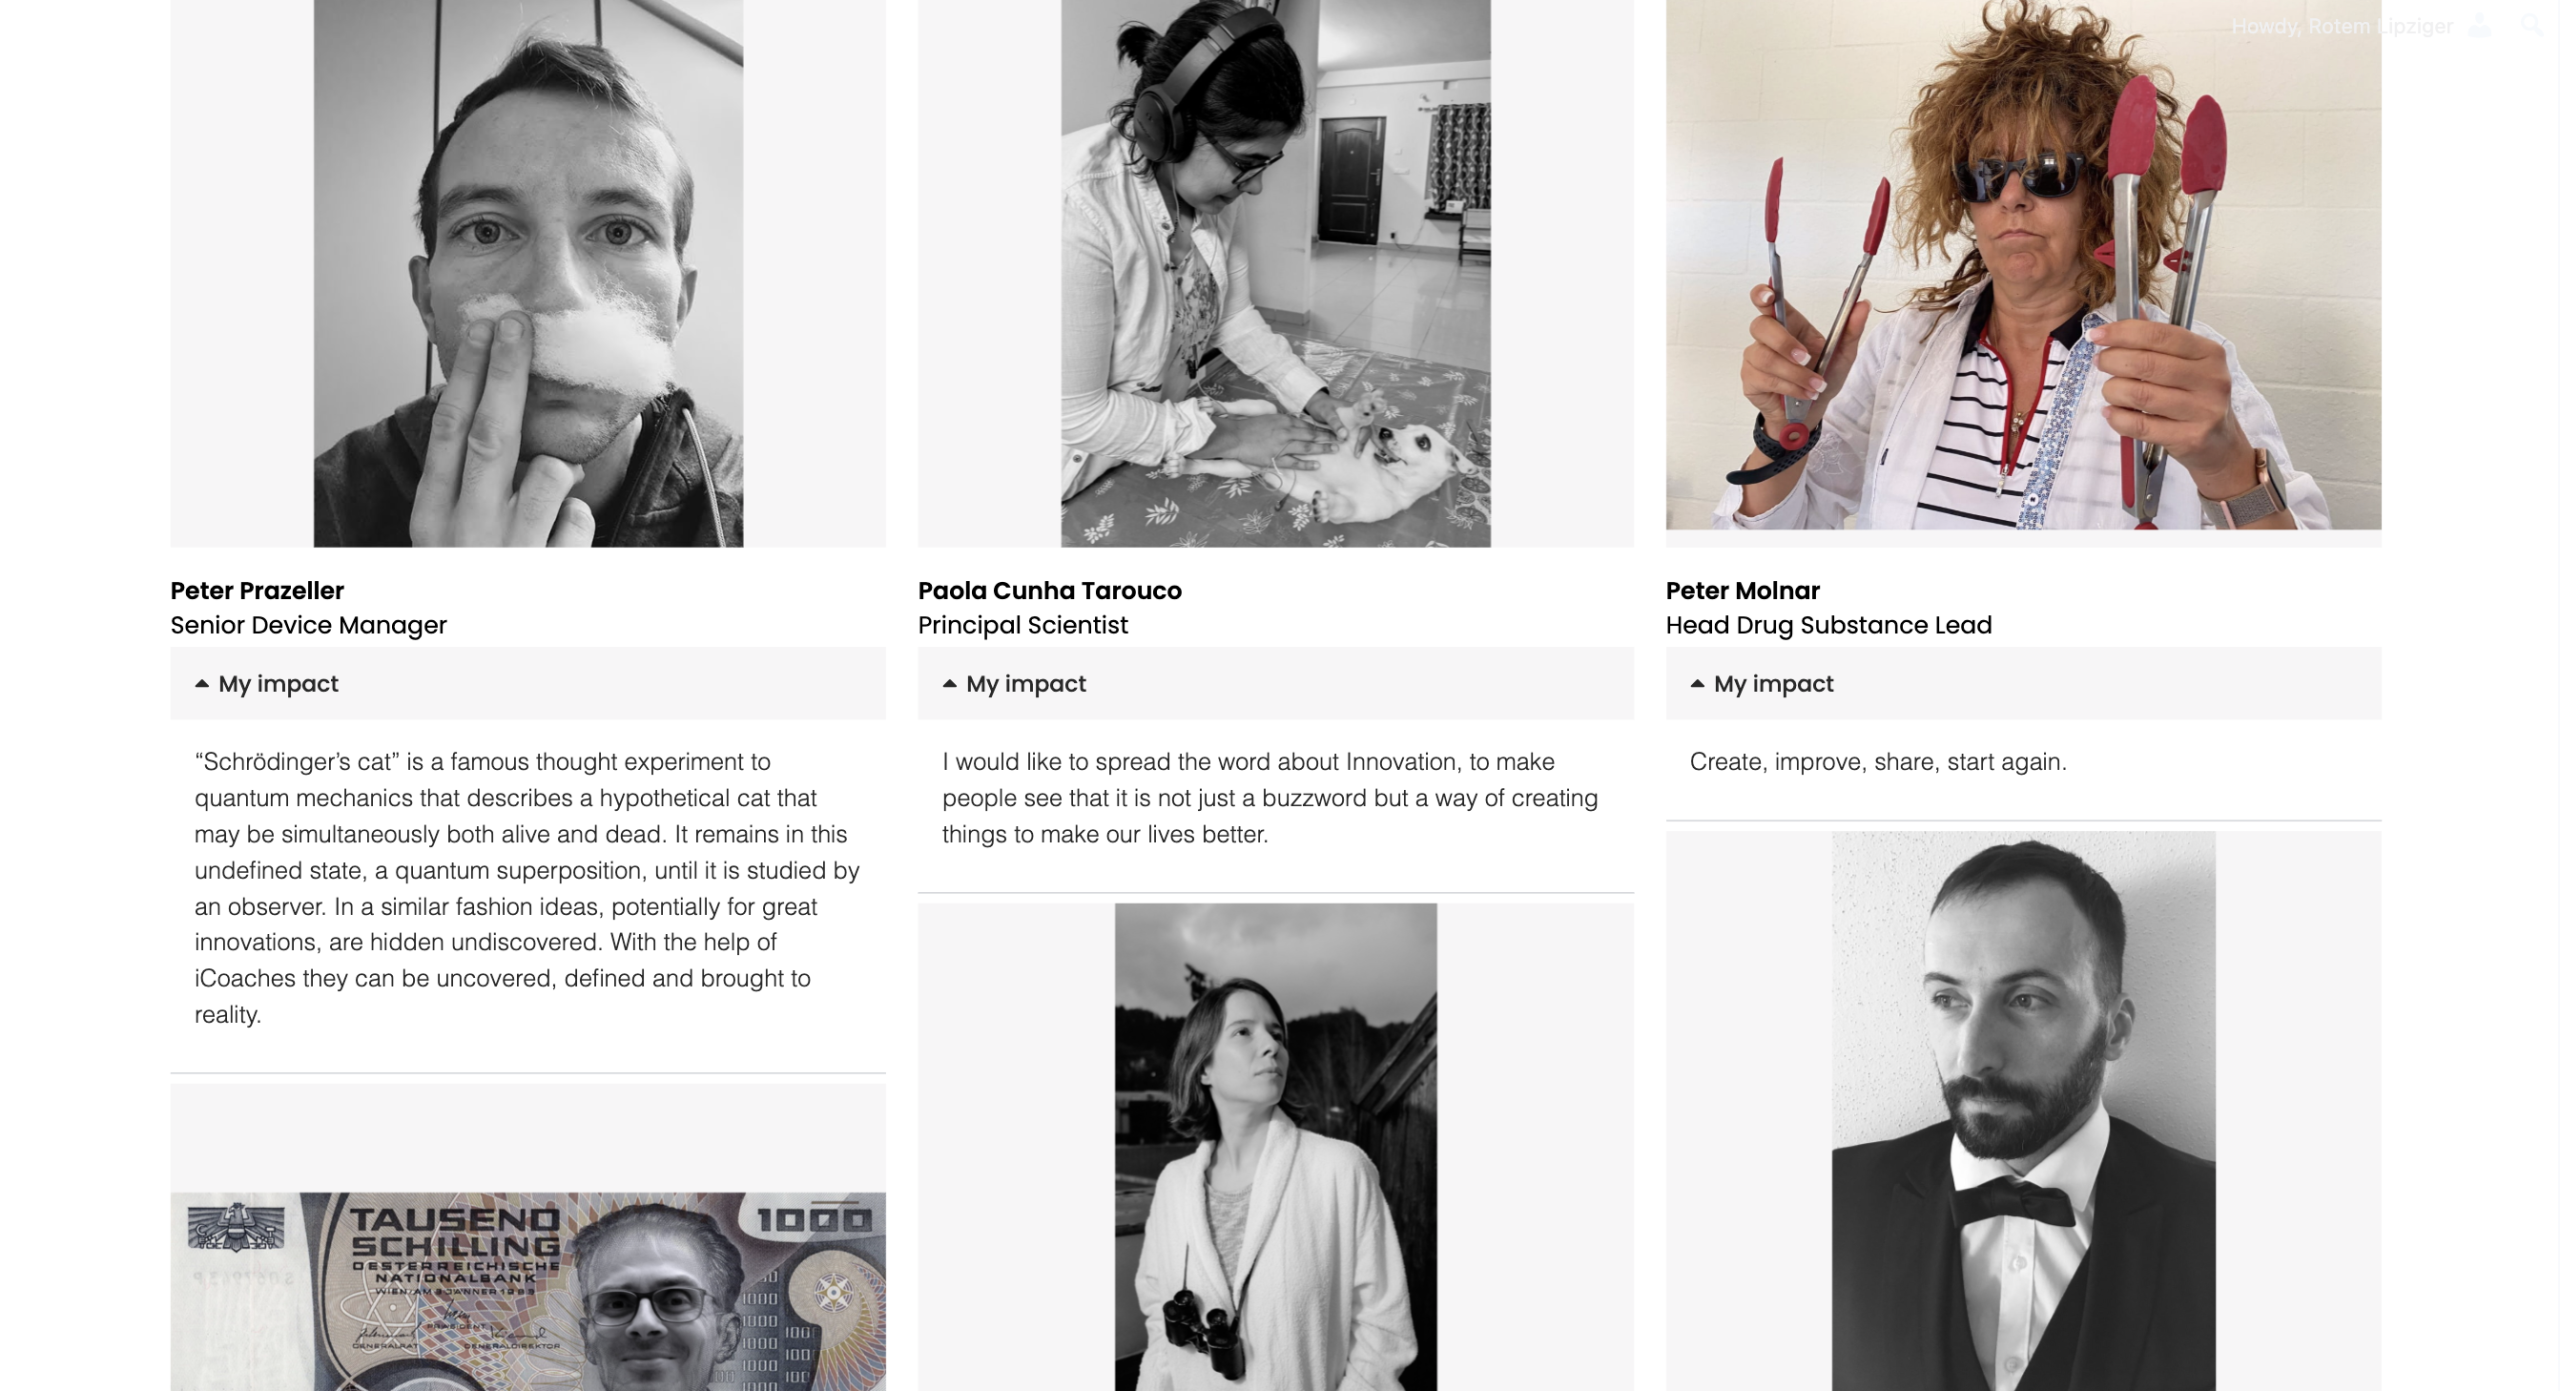
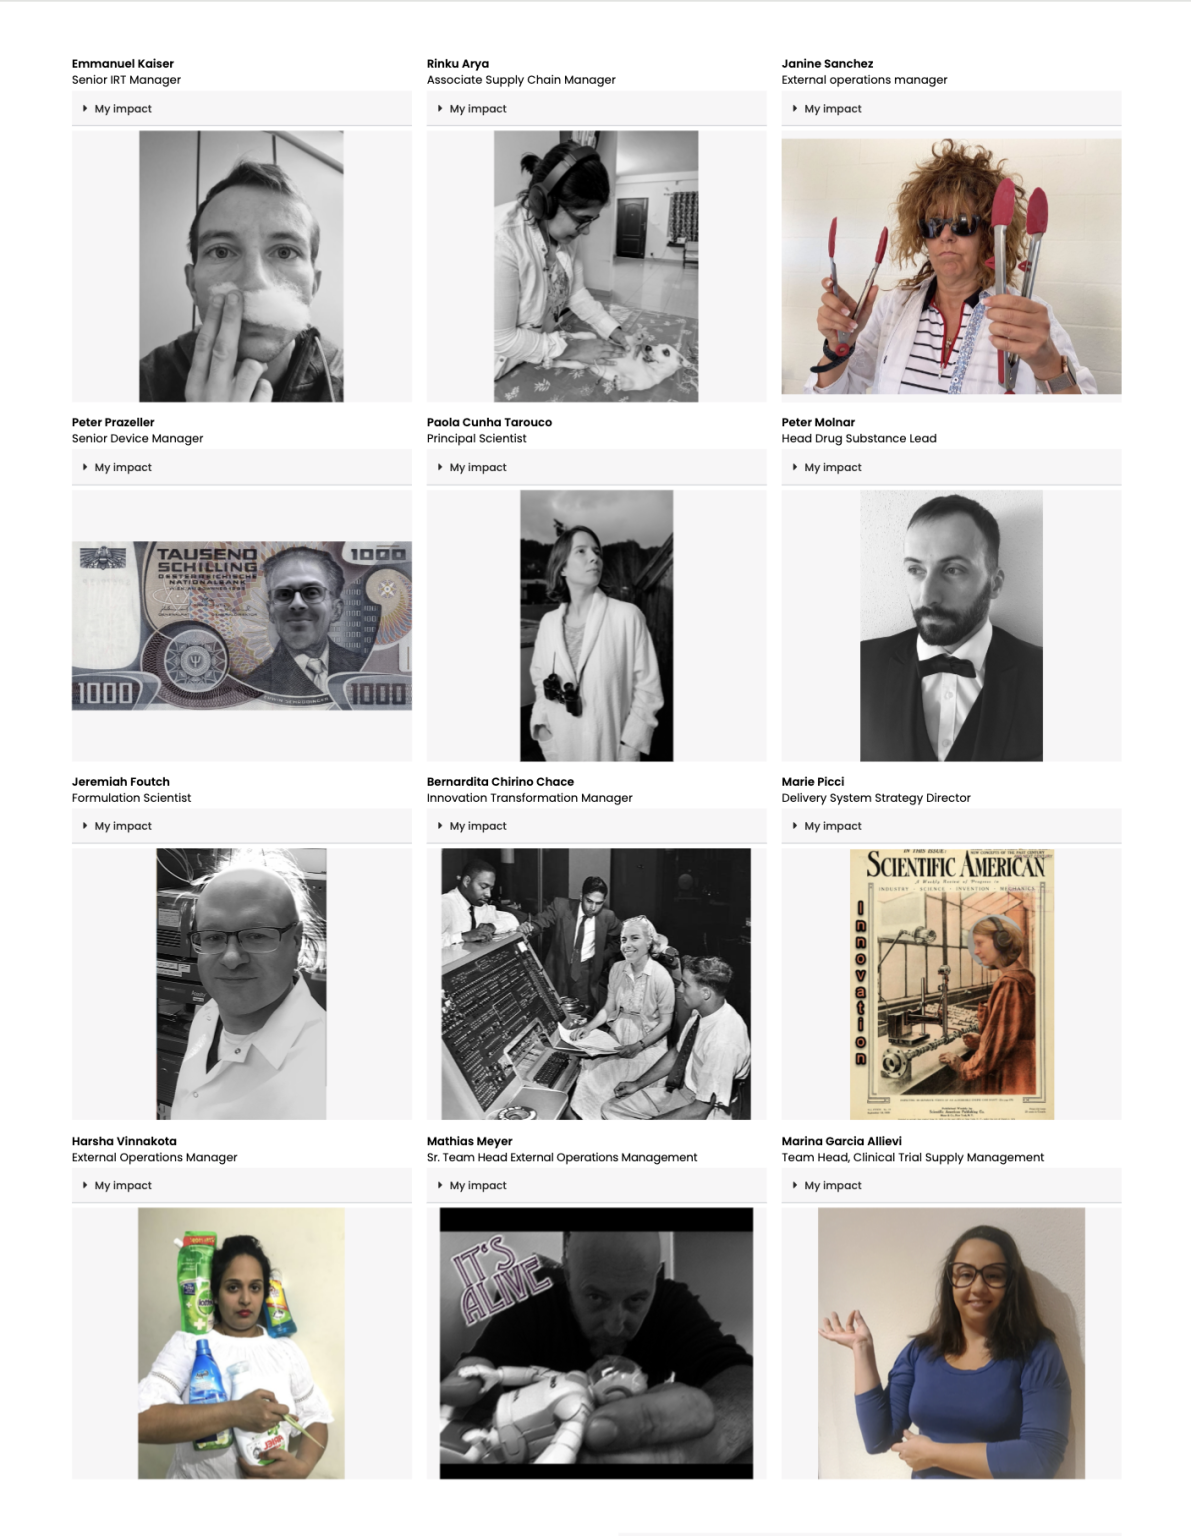
A structured layout that replaced fragmented scrolling, providing immediate visual hierarchy and equal weight to every coach.

02

The ‘Discovery’ flip card

A card-rotation mechanism that hides the humorous “alter-ego” behind the professional portrait, encouraging user engagement.

03

Modal content management

Detailed stories and bios are triggered via clickable elements, keeping the main interface airy and free from information overload.


Selected Screens

Design System

Where science meets art

01

Colour palette

A deliberate balance between clinical precision and creative energy. A minimalist base of professional whites and soft greys creates a clean, ‘laboratory-like’ environment — punctuated by a vibrant spectrum that captures the moment rigid scientific data becomes a fluid, organic spark of progress.

#F7F6F7

Soft grey

#FFFFFF

White

Spectrum

Black → magenta → blue → teal

02

Interactive elements

▸  My impact

03

Typography system

RoleFont familyWeightDesktopMobileLine-height
DisplayPoppinsSemiBold64px36px1.1
HeadingPoppinsBold36px26px1.2
Body / UIRobotoRegular16px15px1.6
QuoteLoraBold24px18px1.4
← Scroll →

"We cannot solve our problems with the same thinking we used when we created them."

Albert Einstein

Reflections

A modular system let the gallery scale to any number of projects without redesign. If I revisited it, I’d test the flip-card discovery pattern with first-time users earlier to validate the metaphor.

Credits & Tools

Design & research: me · Content: SIT + Novartis · Figma, Elementor


Next: The innovation gallery →

Rotem Lipziger · fishrotem@email.com

View live site ↗